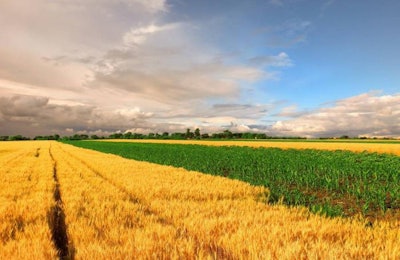
The late planting of corn in the U.S. Corn Belt this spring is expected to bring about a much smaller crop at harvest time. This means less corn will be available for feeding animals, and what will be marketed will be quite expensive.
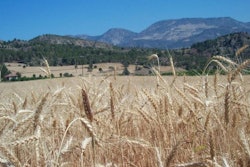
When corn prices spike, alternatives such as wheat and sorghum are sought. And, although the U.S. has considerable experiences feeding sorghum, there are fewer such experiences in the case of wheat. The opposite is true in Canada, and of course Europe, where wheat remains the major cereal for most animal feeds. Thus, transferring some wheat-feeding knowledge across the pond is deemed expedient as we approach corn harvest time in the U.S.
The most important aspect of wheat that we need to keep in mind is that nutrient variability between varieties is often greater than what is to be expected between wheat (as a mean value) and other cereals. For example, protein in corn varies between 6% and 10% (extreme values), with common feed varieties giving a more stable value of 8% protein. In contrast, protein in wheat varies from below 10% (in some soft varieties) to more than 18% (in some hard varieties) with no accepted mean value for all wheat. Thus, before we even want to begin discussing wheat, we must identify the variety, and if not, run a basic (proximate) analysis to be able to formulate diets correctly. In fact, this lack of information is why so often new or occasional users of wheat find it a disappointing exercise.
So, let us examine its nutritive value in more detail.
Energy
It is often said that the energy value of wheat is about 95% of that in corn. Again, this is a generalization as wheat varieties rich in non-starch polysaccharides, which are not utilized at all, can have a much lower energy value. In addition, when protein levels in wheat spike, then starch (energy) is lower, because something must give in to make space for something else. Luckily, there are prediction equations for energy value in wheat, and using them greatly helps bring precision in formulation and predictability in animal performance.
Protein
Protein is a major key nutrient with great variability in wheat. Often, knowing the variety is good enough to have a rough estimate of protein content, but a lab analysis is even better. With wheat, near-infrared (NIR) analysis systems often illustrate their value, assuming they are correctly calibrated using proper and accurate wheat sample values. As far as amino acids go, their levels are not linearly proportional to protein; the same is true for all cereals. For that, there are equations that predict the amount of each amino acid based on protein content, and it is highly advisable such equations be used, especially for wheat.
Lipids
The amount of lipids (oil/fat) in wheat is not much different than that in corn, and no major changes should be expected in fat carcass composition. Perhaps, a bit harder fat carcass will be observed, but this is more evident with other cereals, such as barley, than wheat. Wheat-based diets will require a bit extra added oil or fat in order to keep overall dietary energy levels up. Luckily, soybeans are expected to abound in the U.S. this coming season, and as such soy oil will be relatively inexpensive, making wheat feeding more favorable.
Pigments
Wheat does not contain the same pigments as corn. Thus, eggs, fat, and even milk will not be as yellow/orange as it is from feeding corn. In some cases (fat, milk), this might be desirable, but in others (egg yolk, chicken skin, and even butter), this might be a problem. Adding synthetic or natural pigments is a common practice, but consumers are rarely made aware when synthetic pigments are utilized – a matter pertaining more to consumer politics rather than to technical issues, but something that deserves more discussion.
Fiber
Wheat contains slightly more fiber than corn, and most of it is in the bran section. Not only fiber is more as a whole but its profile is more complicated than that in corn. The non-starch polysaccharides that make up part of the fiber fraction not only reduce available energy and reduce digestibility of other nutrients (as overall fiber does in general), but they can cause specific problems, such as sticky droppings and dirty eggs in chicken. Adding wheat-specific enzymes is believed to alleviate at least some of the above problems, but there is such a plethora of available commercial enzymes that it has become difficult to distinguish science from marketing.
Minerals
In total, wheat contains about the same amount minerals compared to corn – a feature common among all cereals. But there is a peculiar difference in the case of wheat: The bran fraction of wheat contains a natural phytase, the enzyme that improves phosphorus availability/digestibility in monogastric species (pigs and poultry). As such, either less exogenous (commercial) phytase enzyme is required when formulating with wheat instead of corn, or less phosphate salts (mono- or dicalcium phosphates, for example) need to be added.
In general
Compared with corn, wheat is more variable, contains less energy and pigments, and more of protein, fiber and available phosphorus. Usually, the price of wheat in the U.S. does not allow it to enter common feed formulas, despite its advantages. But, when corn prices go up, as they are expected to do so soon, wheat becomes an interesting alternative. Attention to the finer details that often go unnoticed can ensure that using wheat will not bring the usual disappointment due to lost animal performance from miscalculated feed formulas.
