Poultry producers face the challenge of changing distribution and types of mycotoxins in the 2014 crop of feed grains, and this calls for a combination of counteracting strategies, said experts in the WATT Global Media webinar, “Expert outlook on mycotoxin occurrence.”
Of special concern are extremely high levels of deoxynivalenol (DON) and fumonisin (FUM) toxins in the 2014 U.S. corn crop, along with medium levels of contamination with aflatoxin (Afla) and zearalenone (ZEN), which creates the need for a combination of feed detoxification measures, the experts said.
Survey results from sampling of 2014 U.S. corn in the 27 leading production states showed the following:
- 87 percent of corn samples tested positive for mycotoxins
- 36 percent of samples were contaminated with more than one mycotoxin
- 63 percent of corn samples tested positive for DON
- 56 percent of corn samples tested positive for FUM
- Medium levels of aflatoxin Afla and ZEN were found
The testing was conducted by Biomin from January through September 2014 and included 471 samples.
Multiple strategies needed for multiple mycotoxins
Speaking in the webinar, Dr. Raj Murugesan, technical director, Biomin America, said, “Multiple strategies have to be used to counteract multiple mycotoxins challenges.”
The occurrence of multiple mycotoxins in the feed grains poses two significant challenges, he explained. First, their co-occurrence may result in synergistic effects in harming the health of poultry. Second, a single detoxification measure may not be effective for all mycotoxins present.
“Adsorption alone can’t be effective for all mycotoxins,” he said. “Biotransformation/microbial degradation are innovative strategies to detoxify non-adsorbable mycotoxins.”
Mycotoxins present complex challenge
The challenge for poultry and livestock producers from mycotoxins is worldwide and increasingly complex. During the webinar, Dr. Eva Maria Binder, chief scientific officer, ERBER AG, outlined some of the reasons:
- Grain supplies and quality are affected and stressed by climate change, which impacts temperature, rainfall patterns, droughts and CO2
- Afla and FUM production is increasing due to hot and dry conditions that influence gene expression in fungi in some parts of the world
- Fusarium culmorum and Microdochium nivale are being displaced by Fusarium graminearum
Trends in mycotoxin distribution and types
The worldwide distribution and types of mycotoxins are changing over time, Dr. Binder said, which increases the challenge of protecting against mycotoxicosis.
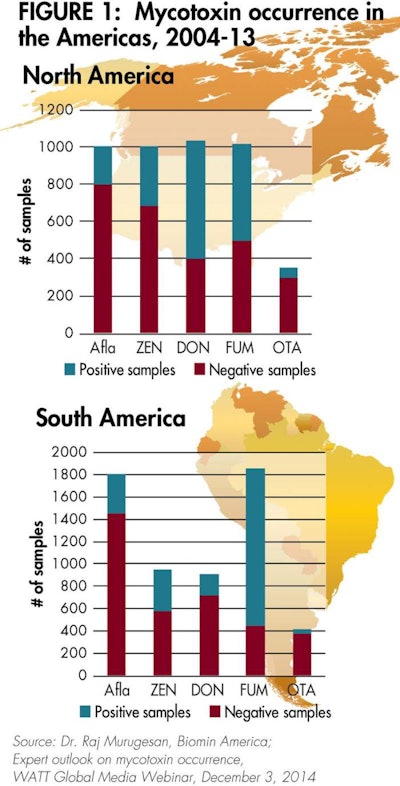
Since 2004, Biomin’s mycotoxin survey has revealed the following high levels of occurrence:
- ZEN in 2006 with 22.4 percent above 100 ppb
- Ochratoxin (OTA) in 2007 with 7.2 percent above 50 ppb
- Afla in 2008 with 23.8 percent above 5 ppb
- FUM in 2009 with 7.1 percent above 5,000 ppb
- DON in 2010 with 18.2 percent at or above 900 ppb
There’s also been increased co-occurrence of mycotoxins, especially aflatoxins with fumonisins. During this period, 42 percent of all samples were contaminated with more than one mycotoxin, and 60 percent of compound feed samples were co-contaminated.
Finished feed posing health threat
Global results for 2014 showed the following percentages of samples of finished feed posing a potential health threat to poultry:
- 15 percent with A-Trichothenes above 50 ppb
- 21 percent with ZEN and metabolites above 50 ppb
- 51 percent with B-Trichothecenes above 200 ppb
Mycotoxin levels in 2014 U.S. corn
Figure 3 shows the mean of the levels of mycotoxins found in Biomin’s survey of 2014 corn.
Dr. Murugesan noted that the mycotoxins registering the highest levels in the 2014 survey are those considered to be “pre-harvest” ones – FUM (17,400 ppb), DON (1,476 ppb) and ZEN (322 ppb). The mycotoxins considered to be “post-harvest” registered lower levels – Afla (36 ppb) and OTA (5 ppb).
Mycotoxin co-occurrence in 2014 corn
Eighty-seven percent of 2014 corn samples registered mycotoxin contamination, while only 13 percent had less-than-detectable limits. Fifty-one percent of samples harbored only one mycotoxin, while 36 percent had more than one mycotoxin.
Corn with multiple mycotoxins in feed poses the greatest risk to poultry and livestock. “The combined negative effects of mycotoxins are greater than their individual effects,” Murugesan said.
For example, in chickens, aflatoxin B1 can have synergistic effects with OTA, T-2 toxin, diacetoxyscirpenol and cyclopiazonic acid in causing mycotoxicosis. And T-2 toxin has been demonstrated to have a synergistic effect with DON and additive effects with fumonisin B1 and OTA.
Mycotoxin detoxification strategies
“Proper mycotoxin risk management is crucial in order to protect animals from the negative effects of mycotoxins,” Murugesan said. “The variation in mycotoxins’ molecular structure, however, requires a combination of detoxification strategies.”
Anorganic and organic binders represent a chemical method of detoxification. These agents, such as bentonites, work to detoxify the mycotoxins in descending order of adsorption efficacy: aflatoxins, ergot alkaloids, ochratoxins, fumonisins, zearalenone, T-2 toxin and deoxynivalenol.
Biotransformation is one of two biological methods of detoxification. This includes the use of microbials and enzymes.
Bioprotection is a second biological method. It includes the use of phytogenics and phycophytics:
- Phytogenic substances work to inhibit pro-inflammatory effects and stabilize hepatocyte and cell membranes. These provide liver protection.
- Phycophytic substances are designed to strengthen natural immune response and compensate immune suppressive effects of mycotoxins.
Multiple strategies needed for multiple mycotoxins
“Adsorption alone can’t be effective for all mycotoxins,” Murugesan said. “Biotransformation and microbial degradation are innovative strategies to detoxify non-adsorbable mycotoxins. Multiple strategies have to be used to counteract the challenge of multiple mycotoxins.”
(4,730), South Dakota (4,600), Ohio (3,591), Arizona (3,538), Illinois (3,333), Michigan (2,776), California (2,044), Nebraska (2,040), Connecticut (1,300), Missouri (1,300), Florida (974) and Vermont (700).
Fumonisin maximum levels (ppb) were highest in Iowa (51,500), California (24,132), Missouri (17,000), Kansas (7,181), Wisconsin (6,551), Texas (5,710), South Dakota (5,400), Florida (5,191), Georgia (3,512), Illinois (
3,190), Alabama (2,821), Ohio (2,562), Nebraska (2,400) and North Carolina (1,524).
T-2 toxins maximum levels (ppb) were highest in Wisconsin (282), Illinois (210), Iowa (112) and Ohio (112).


