Maro Ibarburu, program manager for the Egg Industry Center, located at Iowa State University, released the February-March Statistical Report, which was prepared in collaboration with Don Bell of the University of California at Riverside.
The outstanding factor influencing profitability in our industry continues to be the high price of corn. During March, layer feed was $288 per ton or 51 cents per dozen across the six regions surveyed by the USDA. This is a 46% increase over March 2010. The escalation in corn price can be attributed directly to ethanol diversion in addition to increased demand from China, India and some other nations. The profit situation is also exacerbated by seasonal depressed prices for generic eggs.
The current report as distributed by the EIC is summarized for readers of Egg Industry. The major trends over the past month are noted in the statistics and comments:
- The U.S. estimated (six region) cost of production for March 2011 was 76.2 cents per dozen ex farm, which is 1.9 cents per dozen or 2.6% more than in January 2011. The range in production cost among regions extended from 70.1 cents per dozen in the Midwest to 80.1 cents per dozen in California with the Southeast at 79.8 cents per dozen.
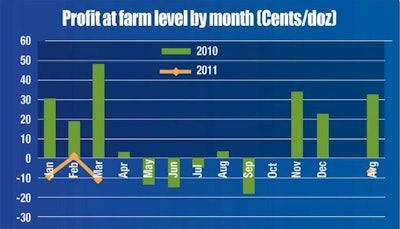
- The negative margin represented by “income minus cost” for March 2011 rose to -11 cents per dozen compared to -0.3 cents per dozen in February 2011 compared to a positive margin of 48.6 cents per dozen in March 2010. For 2011, the average margin during the first quarter amounted to -6.6 cents per dozen compared to a positive value of 32.8 cents per dozen for the first three months of 2010.
- In evaluating the negative margin for March 2011, it was noted that average feed cost for the six regions was 51.1 cents per dozen, with pullet depreciation at 10.4 cents per dozen and other fixed and variable costs amounting to 14.7 cents per dozen, applying the standard EIC cost factors. These values, other than the feed and pullet categories, remained unchanged through 2010. It is evident that escalation in ingredient cost coupled with depressed revenue will be the most significant challenges to attaining profitability in 2011.
- In March 2011, producers experienced an ex-farm loss of -11.0 cents per dozen corresponding to -21.1 cents per hen housed based on current monthly cost and revenue values. In comparison, during 2010 ex-farm profit was 9.4 cents per dozen or 232.6 cents per hen.
- The UB simple average producer price for six U.S. regions, assuming 80% large grade eggs, declined by 1.9% to 67.4 cents per dozen for March compared to 76.5 cents per dozen in February 2011. The 2011 cumulative simple average UB price for the first three months of 2011 was 72.8 cents per dozen. The range over the six reported regions for February 2011 was 65.5 cents per dozen for the Midwest to 69.3 cents per dozen for the South Central Region.
- The USDA-AMS determined an ex-farm price of 69.7 cents per dozen for March 2011 compared to 80.9 cents per dozen in February. Corresponding warehouse/distribution center and store delivery prices in March 2011 were 86.4 cents per dozen and 91.9 cents per dozen respectively. These values were approximately 12% lower than the previous month. The farm-to-store spread was 22.17 cents per dozen, which was 6.3% lower than the value of 23.7 cents per dozen for the previous month. Average ex-farm price for 2010 was 76.8 cents per dozen which is 6.2% higher than in 2009. For the first quarter of 2011 ex farm price was 17.8 cents per dozen or 19% lower than the 94.8 cents per dozen during the corresponding quarter of 2010.
- In reviewing retail prices for table eggs, the Bureau of Labor Statistics and the Department of Commerce estimated a February 2011 retail average of 170.8 cents per dozen. The simple average retail egg price for 2010 was 166.4 cents per dozen.
- The Large-to-Medium grade white-egg price spread over six regions was 8.4 cents per dozen in March compared to 12.6 cents per dozen in February with an average spread of 22.8 cents per dozen during 2010. Regional spreads in March ranged from 7.0 cents per dozen in the Midwest to 11.3 cents per dozen in the South Central Region.
- During March 2011, layer feed averaged $287.80 per ton, which is 1.2% higher than the $291.20 per ton average based on six regions during February 2010. During March the price range among regions was $257.60 per ton in the Midwest rising to $306.20 per ton for the Southeast and California. The differential of $48.60 per ton is equivalent to approximately 8.4 cents per dozen applying realistic industry production parameters.
- In March 2011, there were 39.98 million table egg-strain eggs in incubators. During 2010, the volume of eggs under incubation remained almost constant at an average of 38.73 million with a range of 33.4 million in August to 42.9 million in April 2010. The average number of eggs in incubators during the first three months of 2011increased by 1.1% with March showing a 3% increase over 2010.
- Pullet chicks hatched in March 2011 attained 18.7 million compared to a monthly average of 20.5 million chicks during 2010.
- Projections for pullets to be housed in future months based on the five months-previous hatch and incorporating a 5% mortality factor, included a range in the increase of placements from 17.08 million pullets in May 2011 to 18.67 million pullets in June 2010. The 12-month average of 18.21 million pullets per month for 2010 is 5.5% greater (1.0 million pullets) than the 12-month average of 17.26 million per month for 2009. The 2006 to 2010 monthly average was 15.96 million pullets placed each month. The projected total for January to July 2011 will be 123.7 million pullets, which is 2.3% higher than the corresponding 7 months of 2010. This has obvious implications for market price.
- For February 2011, the USDA-NASS estimated the national flock at 282.0 million hens, which was 0.9% lower than in January 2011. Applying the University of California model based on USDA-NASS data for chickens and eggs, it is estimated that the April 2011 flock would attain 283.4 million hens, rising to 287.6 million in December 2011, with a low value of 281.3 million hens in June 2011. Indications are that there is a general realization that prudence in expansion is dictated by the cost side of the production equation since ingredient prices cannot be constrained.
- As at the end of February 2011, 21.9% of the national flock was over 72 weeks of age. For 2010 an average of 23.4% of the national flock had been molted compared to 24.8% during the corresponding period in 2009. There were 2.8% fewer hens over 72 weeks during January- February 2011 compared to the corresponding two-month period in 2010.
- Six regions reported a simple average of 23.3% molted hens in March 2011, 4% less than in March 2010. The actual proportion of molted hens in the U.S. varies widely, from 12.7% in the Northeast to 34.8% in California. An average of 23.9% molted hens was recorded in the six-regions during 2010. Differences among regions are attributed to production cost, revenue for eggs and realization value for spent hens.
- During February 2011, USDA-FSIS data indicated that 5.6 million hens were processed compared to 5.9 million in January 2011. The FSIS value does not take into account any depleted flocks which are buried, rendered or shipped to Canada.
- In February the University of California projected an UB Large Midwest price of 125.0 cents/dozen for March 2011, compared to an actual value of 104.5 cents per dozen. The lowest projection for 2011 is now 77.2 cents per dozen in May with a November/December price forecast of approximately 111 cents per dozen. Projections are contingent on current trends in flock depletion and consumer demand. It is reiterated that each 10 cent per dozen difference between forecast and actual U-B price is equivalent to $30 million per month for the industry with over 165 million hens producing generic eggs.
- In January 2011, the top six egg-producing states with 158.85 million hens represented 57.2% of the total of 277.5 million hens in flocks above 30,000 hens as recorded by the USDA. In descending order these states are Iowa [18.8% of total], Ohio [9.7%], Indiana [8.3%], Pennsylvania [8.6%], California [6.8%], and Texas [5.1%]. States reporting to the USDA-NASS represent 98.4% of all hens producing table eggs.
- The rate of lay for February 2011 attained 75.3% which is 0.3% lower than the previous month and 2.3% lower than in December 2010 during which an average of 77.4% was recorded. The rates of lay for January 2010 and 2011 were identical. Average rate of lay is a function of weighted flock age and is also influenced by climatic conditions.
- During February 2011, 5,163 million cases of eggs were broken under Federal inspection, which is 8.9% lower than in January 2011. In 2010 breaking was up by 3.9% over 2009. For January and February 2011, 30.5% of the 35.47 million cases produced were broken compared to 31.6% for 2010. It is noted that on a year-to-year basis the proportion of eggs broken has shown a steady decline from the 2005 high of 35.1% to 30.8% in 2009.
- The revised egg consumption value for 2011 estimated by the USDA-ERS is now 248.9 per capita which is 1.5 eggs or 0.6% higher than the consumption value of 246.2 eggs per capita recorded in 2010. Over the past seven years the highest per capita consumption of 257.8 eggs occurred in 2006. It is presumed that the efforts of the American Egg Board through a positive promotional campaign have contributed to the increase in egg consumption.
- During calendar 2010 the USDA-FAS recorded exports of 2.47 million cases of shell eggs representing approximately 1.1% of U.S. production. Major importers during 2010 were Hong Kong/PRC at 40.5% and Canada taking 29.3% of shipments. In January 2011 339,000 cases of shell eggs were exported representing 0.71% of production.
- Combined exports of shell eggs and egg products expressed as “shell-egg equivalents” attained 6,869,000 cases for 2010, representing 3.2% of U.S. production. During January 2011 a combined volume of 471,600 case equivalents of liquid and shell eggs representing 2.5% of production were exported. Major importers of egg products during 2010 were Japan (23.3%), Germany (18.6%), Canada (12.9%), S. Korea (5.7%) and Mexico (4.9%).