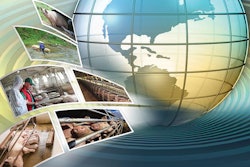
Model helps visualize the interconnectedness of businesses and industries over geographic space
Researchers from Penn State and the Korea Rural Economic Institute have developed a model that could reveal supply chain vulnerabilities in future events such as pandemics or natural disasters.
The model helps to visualize the “interconnectedness of businesses and industries over geographic space,” according to a press release.
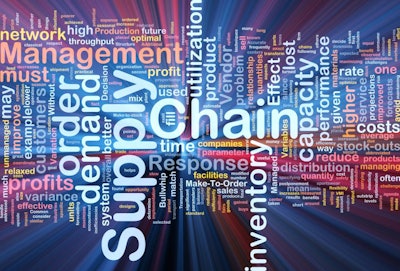
“In any given industry, businesses rely on other industries to supply their inputs or to purchase their products for further processing, and the potential for bottlenecks or disruptions along these supply chains is real; we saw this play out on grocery store shelves across the nation last year,” said Stephan Goetz, professor of agricultural and regional economics and director of the Northeast Regional Center for Rural Development (NERCRD), in the press release. “Our study begins to demonstrate how we can geographically visualize these supply chains for any given sector using publicly available data, so that we may better prepare for future shocks.”
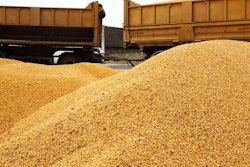
The study applies the model to various sectors of the economy, including grain farming. In the grain farming analysis, researchers “included not only the farms that produce corn, wheat and soybeans but also the businesses that provide those farms with inputs, such as fertilizer and equipment, as well as the processors who purchase grains to produce products ranging from livestock feed, high fructose corn syrup and organic chemicals, to breads and pastries.”
The data visualization shows that, besides the areas of the U.S. where grain is produced, other areas are also important because of their involvement in the overall grain supply chain.
States such as Arkansas, California and Washington “would not appear as critical to the grain industry, if only grain production were considered, as is the case with rudimentary industry location maps,” Goetz said in the press release. “By offering a higher-altitude view of the transactions between industries, the research offers potentially new insights into supply chain vulnerabilities.
“In the case of a pandemic, public agencies and emergency responders could cross-reference these visualizations with data on infection hot-spots, for example, to better understand where protection of workers would be most critically needed in order to soften supply chain disruptions,” he said. “Similarly, knowing where food processors are located relative to a tornado belt or wildfire zone could help them target resources aimed at mitigating disruptions.”
The study shows that most of the grain production activity, including activities related to inputs and processing, tends to be located primarily in rural areas, whereas most of the grain “consumption” activities, including milling, baking and retailing, are located in urban areas.
“To be a strong and sound partner of urban America, rural communities require public and private investments to build physical and human capacity, and investments in rural community development contribute to the well-being of urban areas, as well,” Goetz said.
The researchers plan to build on this work by developing a platform that will allow local decision-makers to study their communities in much more detail, and that will allow users to focus on a particular commodity.
The study, “Visualizing Spatial Economic Supply Chains to Enhance Sustainability and Resilience,” appears in the journal Sustainability.